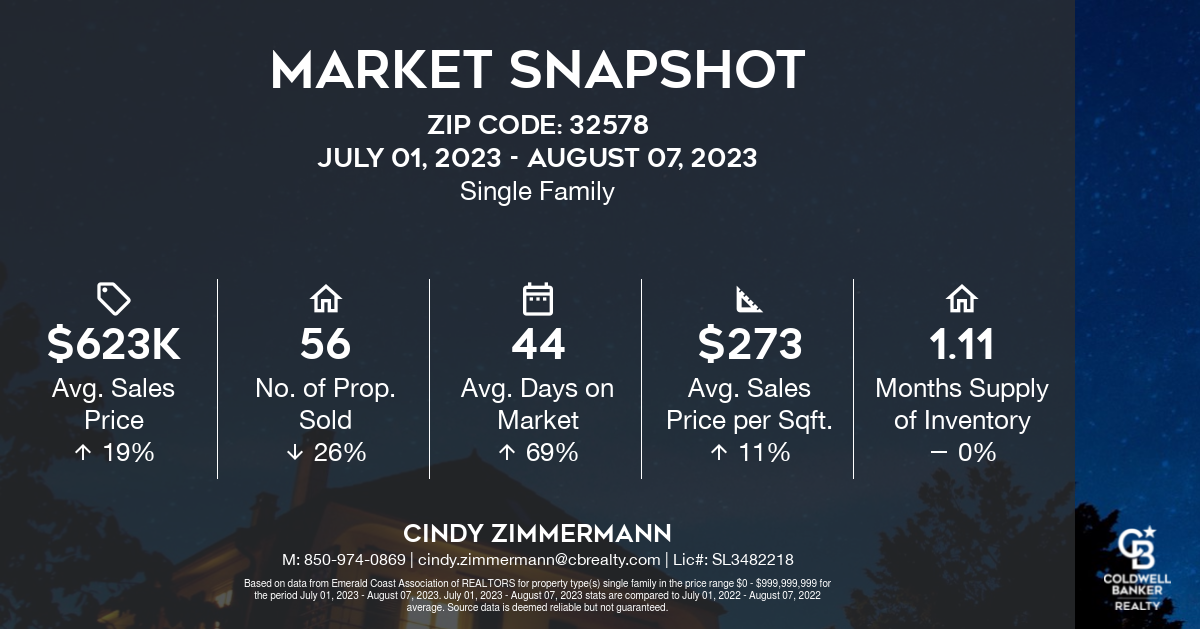
 Real Estate Market Update for 32578 (Niceville). In the world of real estate, there are several important metrics that can provide valuable insights to both buyers and sellers. Today, we will explore these metrics to help you understand the current market conditions and make informed decisions.
Let’s begin with the “Months Supply of Inventory,” which currently stands at 1.11. This metric represents the number of months it would take to sell all the available homes on the market if no new listings were added. A lower number indicates a seller’s market, where demand exceeds supply. This low value of 1.11 suggests that there is a limited inventory of homes available, creating a competitive environment for buyers.
Moving on, we have the “Average Days Homes are On the Market,” which currently stands at value of 44 days. This metric indicates the average number of days it takes for a home to go from being listed to going under contract (a contract that results in a final sale). An upward trend in DOM tends to indicate a move towards a buyer’s market, a downward trend tends to indicate a move towards seller’s market. The DOM for July 2023 was 40 days, up 60.0% from 25 days from the previous month and 81.82% higher than 22 days from July 2022. The July 2023 DOM was at its highest level compared with July 2022 and 2021.
Now, let’s consider the “List to Sold Price Percentage,” which currently sits at 98.5%. This metric reveals the percentage of the original listing price that homes are typically sold for. A higher percentage indicates that sellers are able to secure a price close to their initial asking price. The 98.5% suggests that sellers in this market are getting prices slightly less than their initial asking price. This is actually quite a change from spring of 2022 when the average was 102%.
Next, we have the “Median Sold Price“. This metric represents the midpoint of all the sold prices for homes in the area. A higher median sold price indicates a strong market with high-value properties. This information is useful for both buyers and sellers, as it provides an understanding of the price range in the market. The median sales price in July 2023 was $434,700, down -8.77% from $476,500 from the previous month and -3.40% lower than $450,000 from July 2022. The July 2023 median sales price was at a mid-level compared to July 2022 and 2021.
Lastly, let’s talk about Concessions. This something that is harder to pull data for. Concessions can be anything that sellers or buyers agree to as part of the sale. This spring and summer, I have seen more seller concessions than buyer concessions. While sellers are getting close to asking price, they are often agreeing to replace an old roof, contribute money for buyer’s closing costs and/or offering money to buy down interest rates for buyers’ loan.
In summary, these real estate metrics indicate a highly competitive market with limited inventory. Sellers can take advantage of the favorable conditions, with homes selling reasonably quickly and at prices close to the asking price. On the other hand, buyers need to act swiftly and be prepared to make competitive offers. Understanding these metrics can help both buyers and sellers navigate the current market and make informed decisions. Everything is negotiable! That’s it for the real estate market update for 32578 (Niceville).
If you made it this far, you must have had your morning coffee already!  ![]()
If you’d like to stay up to date on what is happening in your neighborhood, sign up for my neighborhood news.


 Facebook
 X
X
 Pinterest
 Copy Link

